0 引言
快速、准确地检测土壤氮含量是实现精准施肥的前提和基础。利用光谱技术对土壤养分含量预测具有检测速度快、操作简单及环保等优势[1]。利用光谱预测土壤氮含量的大部分研究按照数据预处理、特征工程和模型构建[2-7]等顺序开展,其中特征工程对模型性能有着重要影响。大部分预测模型以特定土壤为目标,模型的泛化能力有待提高[8-10]。
深度学习算法具有优秀的非线性表达和特征提取能力[11],使得将深度学习相关算法应用于土壤氮含量预测成为近年来研究热点。研究人员利用卷积神经网络[12]与其他算法融合[13-15]建立预测模型,研究结果表明深度学习算法可以仅进行少量数据预处理,不需要特征工程的情况下就可以获得较好的模型预测性能。光谱波长间隔对深度学习预测模型影响较大,目前缺少对光谱数据波长间隔选取研究。文献[16]将注意力机制引入土壤氮含量预测,发现注意力机制较卷积神经网络更有助于提高预测精确度。而基于注意力机制的预测模型存在规模过大和训练时间过长等问题。与此同时,泛化能力是制约预测模型实际应用的瓶颈之一。文献[17]提出利用大规模数据集训练模型,能够有效提升模型泛化能力。
为此本文建立一种基于稀疏自注意力机制和可见-近红外光谱的土壤氮含量预测模型(VNIRSformer)。VNIRSformer模型通过稀疏自注意力机制提升模型预测性能和训练速度。探究光谱波长间隔对模型影响,选取最优波长间隔,利用大型公开数据集训练模型来改善模型泛化能力。
1 材料与方法
1.1 数据来源及处理
利用大型公开数据集对模型训练、验证和测试模型泛化能力。公开数据集采用欧盟土地利用及覆盖面积框架统计调查数据集(LUCAS)。LUCAS数据集的土壤样本在2009—2022年期间采集于欧盟各国的农田、林地、灌木、草地、湿地、荒地等地。土壤样本经过40℃风干、去除杂质、研磨和过筛(孔径小于2 mm)处理后,利用 FOSS XDS型光谱分析仪扫描。每个土壤样本正向和反向各扫描一次,取两次扫描结果平均值作为该样本光谱数据。利用凯氏定氮法测量土壤氮含量。LUCAS数据集共含有20 791 个样本,每个样本由400~2 500 nm内土壤吸光度和土壤氮含量组成,波长间隔为0.5 nm。每个样本包含4 201个数据。将公开数据集按比例8∶1∶1划分为训练集(16 631)、验证集(2 080)和测试集(2 080)。 其中,训练集和验证集数据用于模型训练,测试集数据用于评价模型预测性能。
将公开数据集进行标准化处理以消除量纲影响,计算公式为
(1)
式中 x——标准化前的数据
y——标准化后的数据
![]() 数据均值
数据均值
σ——数据标准差
1.2 模型建立
VNIRSformer模型由输入层、嵌入层、编码器、解码器、预测层、输出层组成。模型总体结构和模型参数设置分别如图1和表1所示。
表1 VNIRSformer模型参数说明及设置
Tab.1 VNIRSformer parameters illustration and setting
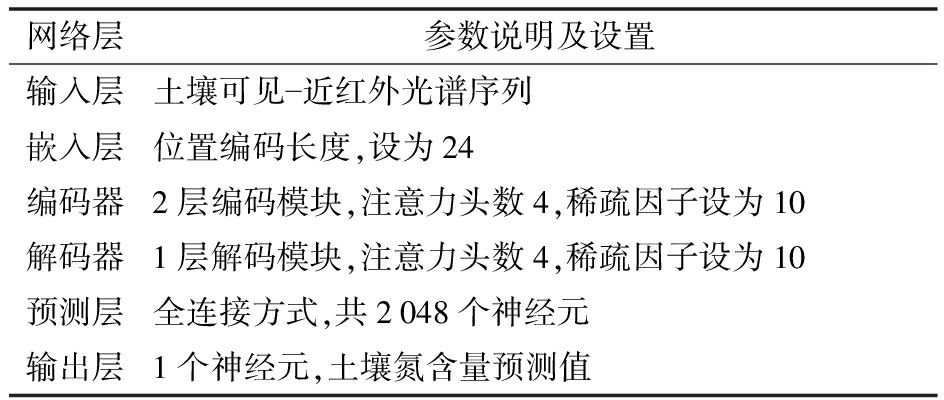
网络层参数说明及设置输入层土壤可见近红外光谱序列嵌入层位置编码长度,设为24编码器2层编码模块,注意力头数4,稀疏因子设为10解码器1层解码模块,注意力头数4,稀疏因子设为10预测层全连接方式,共2048个神经元输出层1个神经元,土壤氮含量预测值

图1 VNIRSformer模型结构
Fig.1 Structure of VNIRSformer
其中,嵌入层将光谱数据编入位置信息,并形成编码器和解码器所需要数据格式;编码器和解码器生成用于预测氮含量的特征集;预测层根据特征集预测土壤氮含量。
不同波段的吸收光谱与土壤氮含量的相关性不同,对土壤氮含量预测贡献度不同。在光谱序列中加入波段信息(即位置),有助于寻找到与土壤氮含量有较强相关性的敏感波段,改善模型性能。位置信息编码方式有多种,如基于正余弦的编码方式[18]和基于可学习编码矩阵的编码方式[19]等。正余弦编码能体现出吸光度的绝对位置和相对位置。本文选用正余弦编码方式生成位置矩阵,计算公式为
(2)
(3)
式中 P——编码得到的位置矩阵
A——原始光谱吸光度序列
i——位置矩阵中位置序号
lA——光谱序列长度
将土壤光谱序列与位置矩阵对齐后,将二者合并作为嵌入层输出,合并公式为
S=(a1+p1,a2+p2,…,ai+pi,…,an+pn)
(4)
式中 S——融合位置信息光谱序列
ai——光谱序列第i个位置吸光度
pi——第i个波长对应的位置矩阵
n——波长总数
编码器由2个相同编码模块组成,每个编码模块包含2个子模块。编码模块结构如图2a所示。
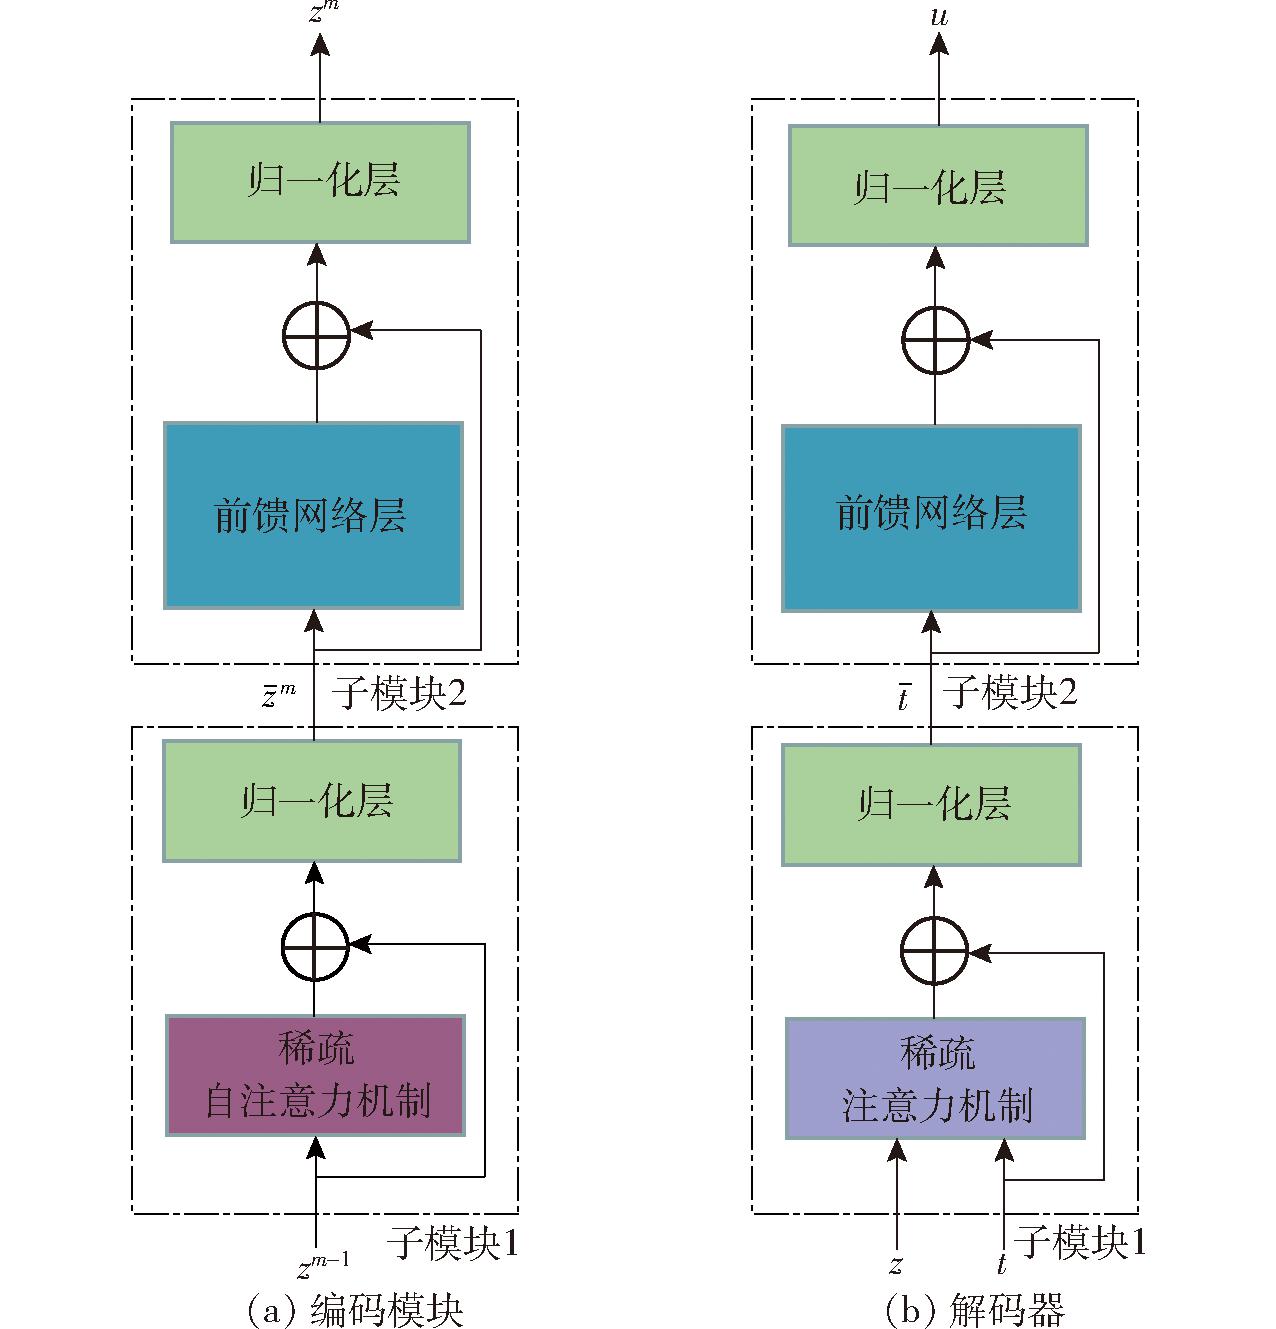
图2 编码模块和解码器结构
Fig.2 Structure of encoder module and decoder
编码模块计算公式为
(5)
其中
(6)
式中 zm——编码模块输出值,其中z0为嵌入层输出值
![]() 编码模块中子模块1输出值
编码模块中子模块1输出值
m——编码模块编号
LN——归一化层算法
PA——稀疏自注意力机制算法
FN——前馈网络层算法
解码器分为2个子模块,具体结构如图2b所示。解码器计算公式为
(7)
其中
(8)
式中 ![]() 解码器中子模块1输出值
解码器中子模块1输出值
t——嵌入层输出值
z——编码器输出值
u——解码器输出值
BA——稀疏注意力机制算法
稀疏自注意力机制[20]通过筛选查询向量Q中有代表性的元素参与注意力计算以实现在保证模型性能的同时降低模型复杂度。具有代表性元素的筛选思路具体如下。
利用权重得分衡量qi在Q中代表性程度。权重得分计算公式为

(9)
式中 qi——Q中第i行向量
lK——关键向量K总行数
![]() 中第 j行向量
中第 j行向量
dK——K的总列数
W——权重得分
对于Q中每个行向量qi,按照随机方式从K中抽取M个行向量k组成![]() 计算公式为
计算公式为
M=flnlK
(10)
式中 f——稀疏因子
通过权重得分S从Q中选取前N个得分最高的行向量q组成稀疏矩阵![]() 其中N计算公式为
其中N计算公式为
N=flnlQ
(11)
式中 lQ——Q总行数
使用稀疏矩阵![]() 与K、价值向量V进行稀疏注意力计算,计算公式为
与K、价值向量V进行稀疏注意力计算,计算公式为
(12)
式中 T——注意力得分
softmax——归一化指数函数
1.3 模型训练
模型主要超参数如下:批量大小(batch_size)为16。初始学习率(learning_rate)为0.000 9。学习率衰减(learning_rate decay)方案为每20轮训练后下降为原来的1/2。激活函数(activation)为GeLU。优化器(optimizer)为Adam。训练轮次(epochs)为100。停止训练标准(early-stopping)为20个训练轮次中损失值不再下降。
模型利用Pytorch 1.7.0实现。硬件环境:CPU为Intel Core i7-7700K 4.20 GHz;RAM为16 GB;GPU为GeForce RTX3090(24 GB)。
1.4 模型评价指标
利用决定系数R2、均方根误差(RMSE)和相对误差分析(RPD)3个指标评价模型性能。决定系数越接近1,说明模型拟合程度越好,预测性能越高。均方根误差与决定系数呈负相关,决定系数越大,均方根误差越小。相对误差分析是通过R2倒数获得,用于评价模型稳定性。RPD越大,说明模型稳定性越好。
2 结果与讨论
2.1 波长间隔对模型预测性能的影响
模型输入为土壤光谱序列,波长间隔决定序列长度,影响模型预测精度和规模。为分析波长间隔对模型预测性能的影响,选取最优输入波长间隔,设置15种不同波长间隔进行实验。不同波长间隔下模型预测性能如图3所示。可以发现,随着波长间隔增加,模型预测精度呈先升后降的趋势。当波长间隔为1 nm的模型预测精度最低,RMSE为0.47 g/kg,R2为0.78。输入波长间隔为5 nm的模型预测精度最高,RMSE为0.35 g/kg,R2为0.89。在一定范围内增大波长间隔可减少光谱序列中共线性和冗余[21],提升预测精度。当波长间隔大于5 nm,会损失部分光谱特征,导致模型预测性能下降。图4展示了不同波长间隔下的模型参数量变化。从图4来看,随着波长间隔增大,模型参数量不断变小。波长间隔从0.5 nm变为1 nm时,模型参数量下降最快,降低比例约为72%。当波长间隔增加至5 nm后,模型参数量下降比例平稳,约为5%。光谱波长间隔对模型性能影响较大,选取合适的波长间隔能够有效提高模型预测性能,降低模型规模。当波长间隔为5 nm时,模型预测精度最高,模型规模适中。
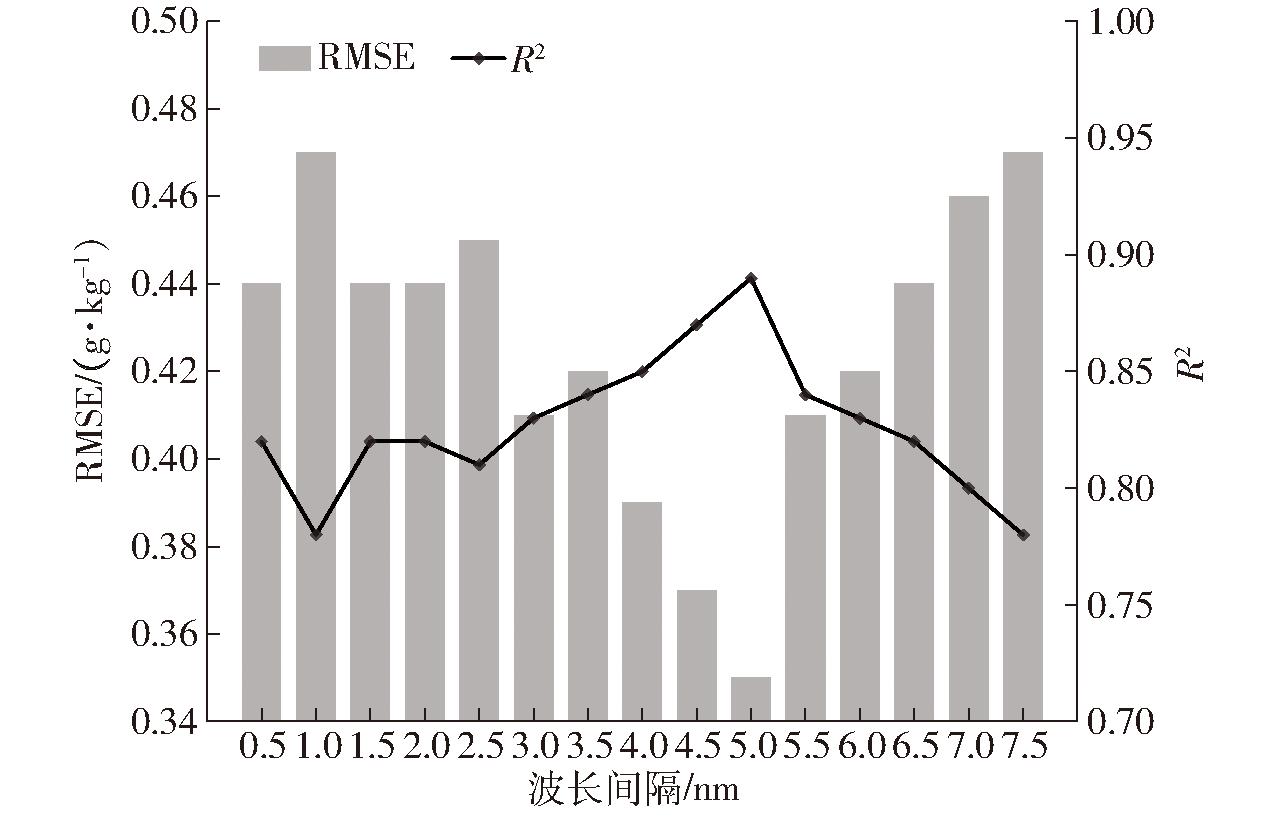
图3 不同波长间隔模型预测性能
Fig.3 Prediction performance of model with different wavelength intervals
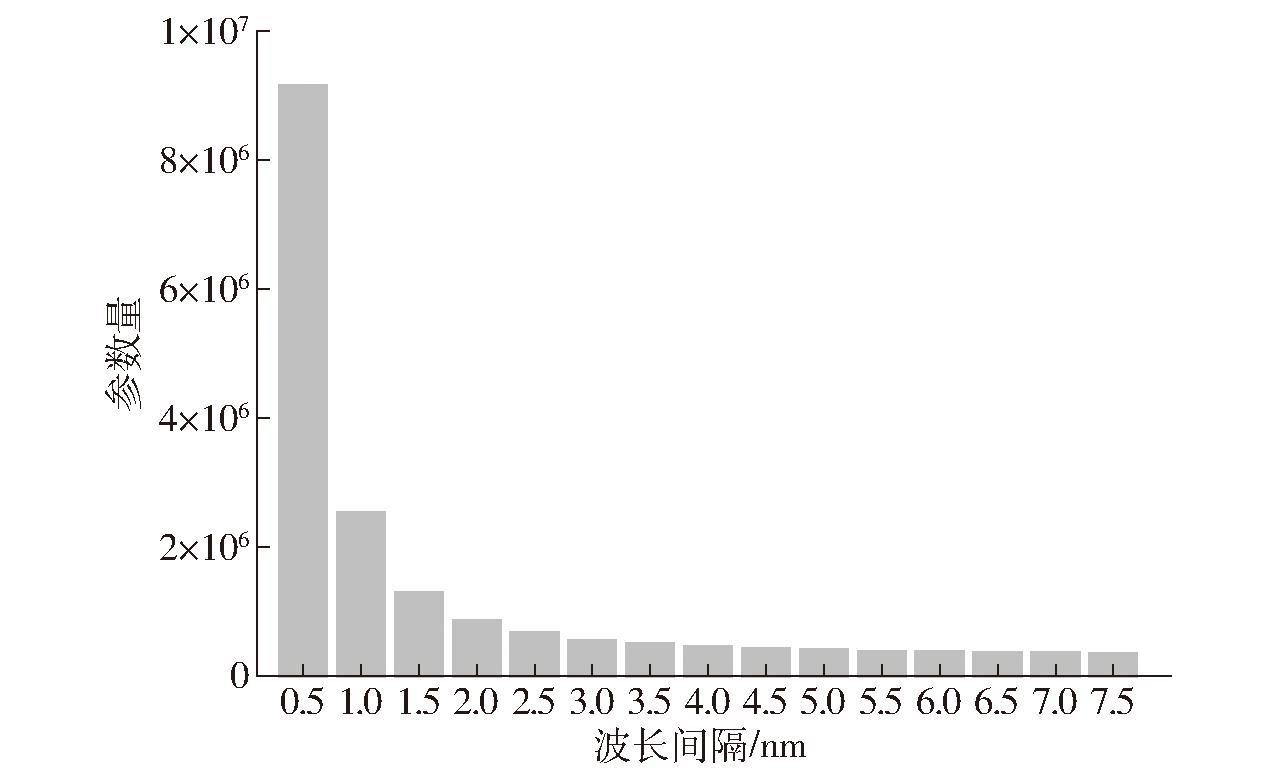
图4 不同波长间隔模型参数量
Fig.4 Parameter number of model with different wavelength intervals
2.2 不同预测模型对比
选取3种传统预测模型和3种深度学习预测模型与VNIRSformer模型对比实验。传统预测模型分别采用偏最小二乘回归(PLS)、支持向量机回归(SVR)和K近邻回归(KNN)3种经典算法。 3种深度学习模型分别为两种卷积神经网络模型[22-23]和基于传统自注意力机制的模型。上述模型均利用相同训练数据集和1.3节的环境进行训练,然后在相同测试集上进行性能测试。测试结果如表2所示。
表2 7种模型在测试数据集上的预测性能
Tab.2 Prediction performance of seven models on test dataset

模型评价指标R2RMSE/(g·kg-1)RPDVNIRSformer0.890.352.95传统自注意力模型0.880.362.86CNN10.830.422.44CNN20.850.392.59PLS0.810.452.31SVR0.790.472.19KNN0.780.482.15
可以发现,3种传统预测模型中,K近邻回归和支持向量机回归的R2均低于0.8,预测效果较差。偏最小二乘回归的R2为0.81,是传统预测模型中性能最优的。在深度学习模型中,预测性能最差为CNN1模型,由于CNN2模型层数大于CNN1,CNN2模型性能有所提升,注意力机制模型性能普遍高于卷积神经网络模型。VNIRSformer模型预测精度最高,较3种传统预测模型R2分别提高0.08、0.10和0.11,较3种深度学习预测模型R2分别提高0.01、0.06和0.04。
VNIRSformer模型与传统自注意力模型的参数量相同(均为4.062×10⁸),浮点计算量分别为1.4×10⁶和1.6×10⁶。计算量降低的原因在于稀疏自注意力降低运算复杂度。进一步考察模型训练时间,如图5所示。可以看出,VNIRSformer模型所用训练时间更少。在训练轮数较少时,两种模型训练所用时间差距较小,随着训练轮数增加,两种模型所用训练时间差距不断增大,当训练轮数达到50时,VNIRSformer比传统自注意力模型所用时间减少260 s。
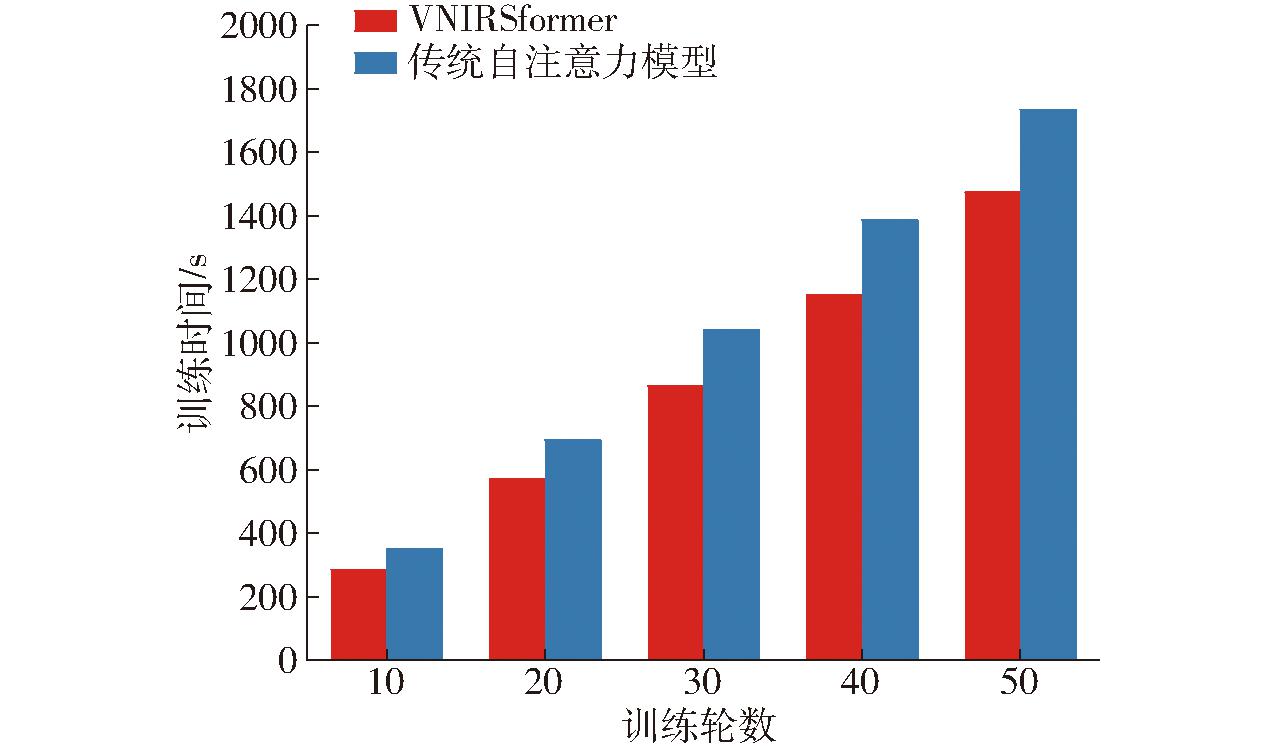
图5 两种自注意力模型训练时间
Fig.5 Time of two self-attention models under different training rounds
2.3 模型预测性能及泛化能力验证
为验证VNIRSformer模型对不同土壤氮含量的预测性能,本文按照全国第二次土壤普查养分分级标准[24-25],将土壤氮含量(质量比)分为8个级别。其中,第1级别土壤氮含量大于10.0 g/kg,第2级别到第7级别土壤氮含量分别为5.0~10.0 g/kg、2.0~5.0 g/kg、1.5~2.0 g/kg、1.0~1.5 g/kg、0.75~1.0 g/kg、0.5~0.75 g/kg,第8级别的土壤氮含量小于0.5 g/kg。
训练集、验证集和测试集在不同土壤氮含量级别上的样本分布及统计信息如表3所示。从表3可以看出,3种数据集的数据分布基本一致。
表3 3种数据集数据分布及统计信息
Tab.3 Data distribution and statistical information of three datasets

数据集不同级别下样本比例/%12345678最小值/(g·kg-1)最大值/(g·kg-1)平均值/(g·kg-1)标准差/(g·kg-1)训练集4.36.934.816.619.510.84.72.40.237.63.13.7验证集4.26.834.516.819.410.94.82.60.336.62.93.4测试集4.36.934.716.619.410.84.82.50.236.23.13.6
利用VNIRSformer模型分别对测试集内8个级别的土壤氮含量进行预测,预测结果如图6所示。
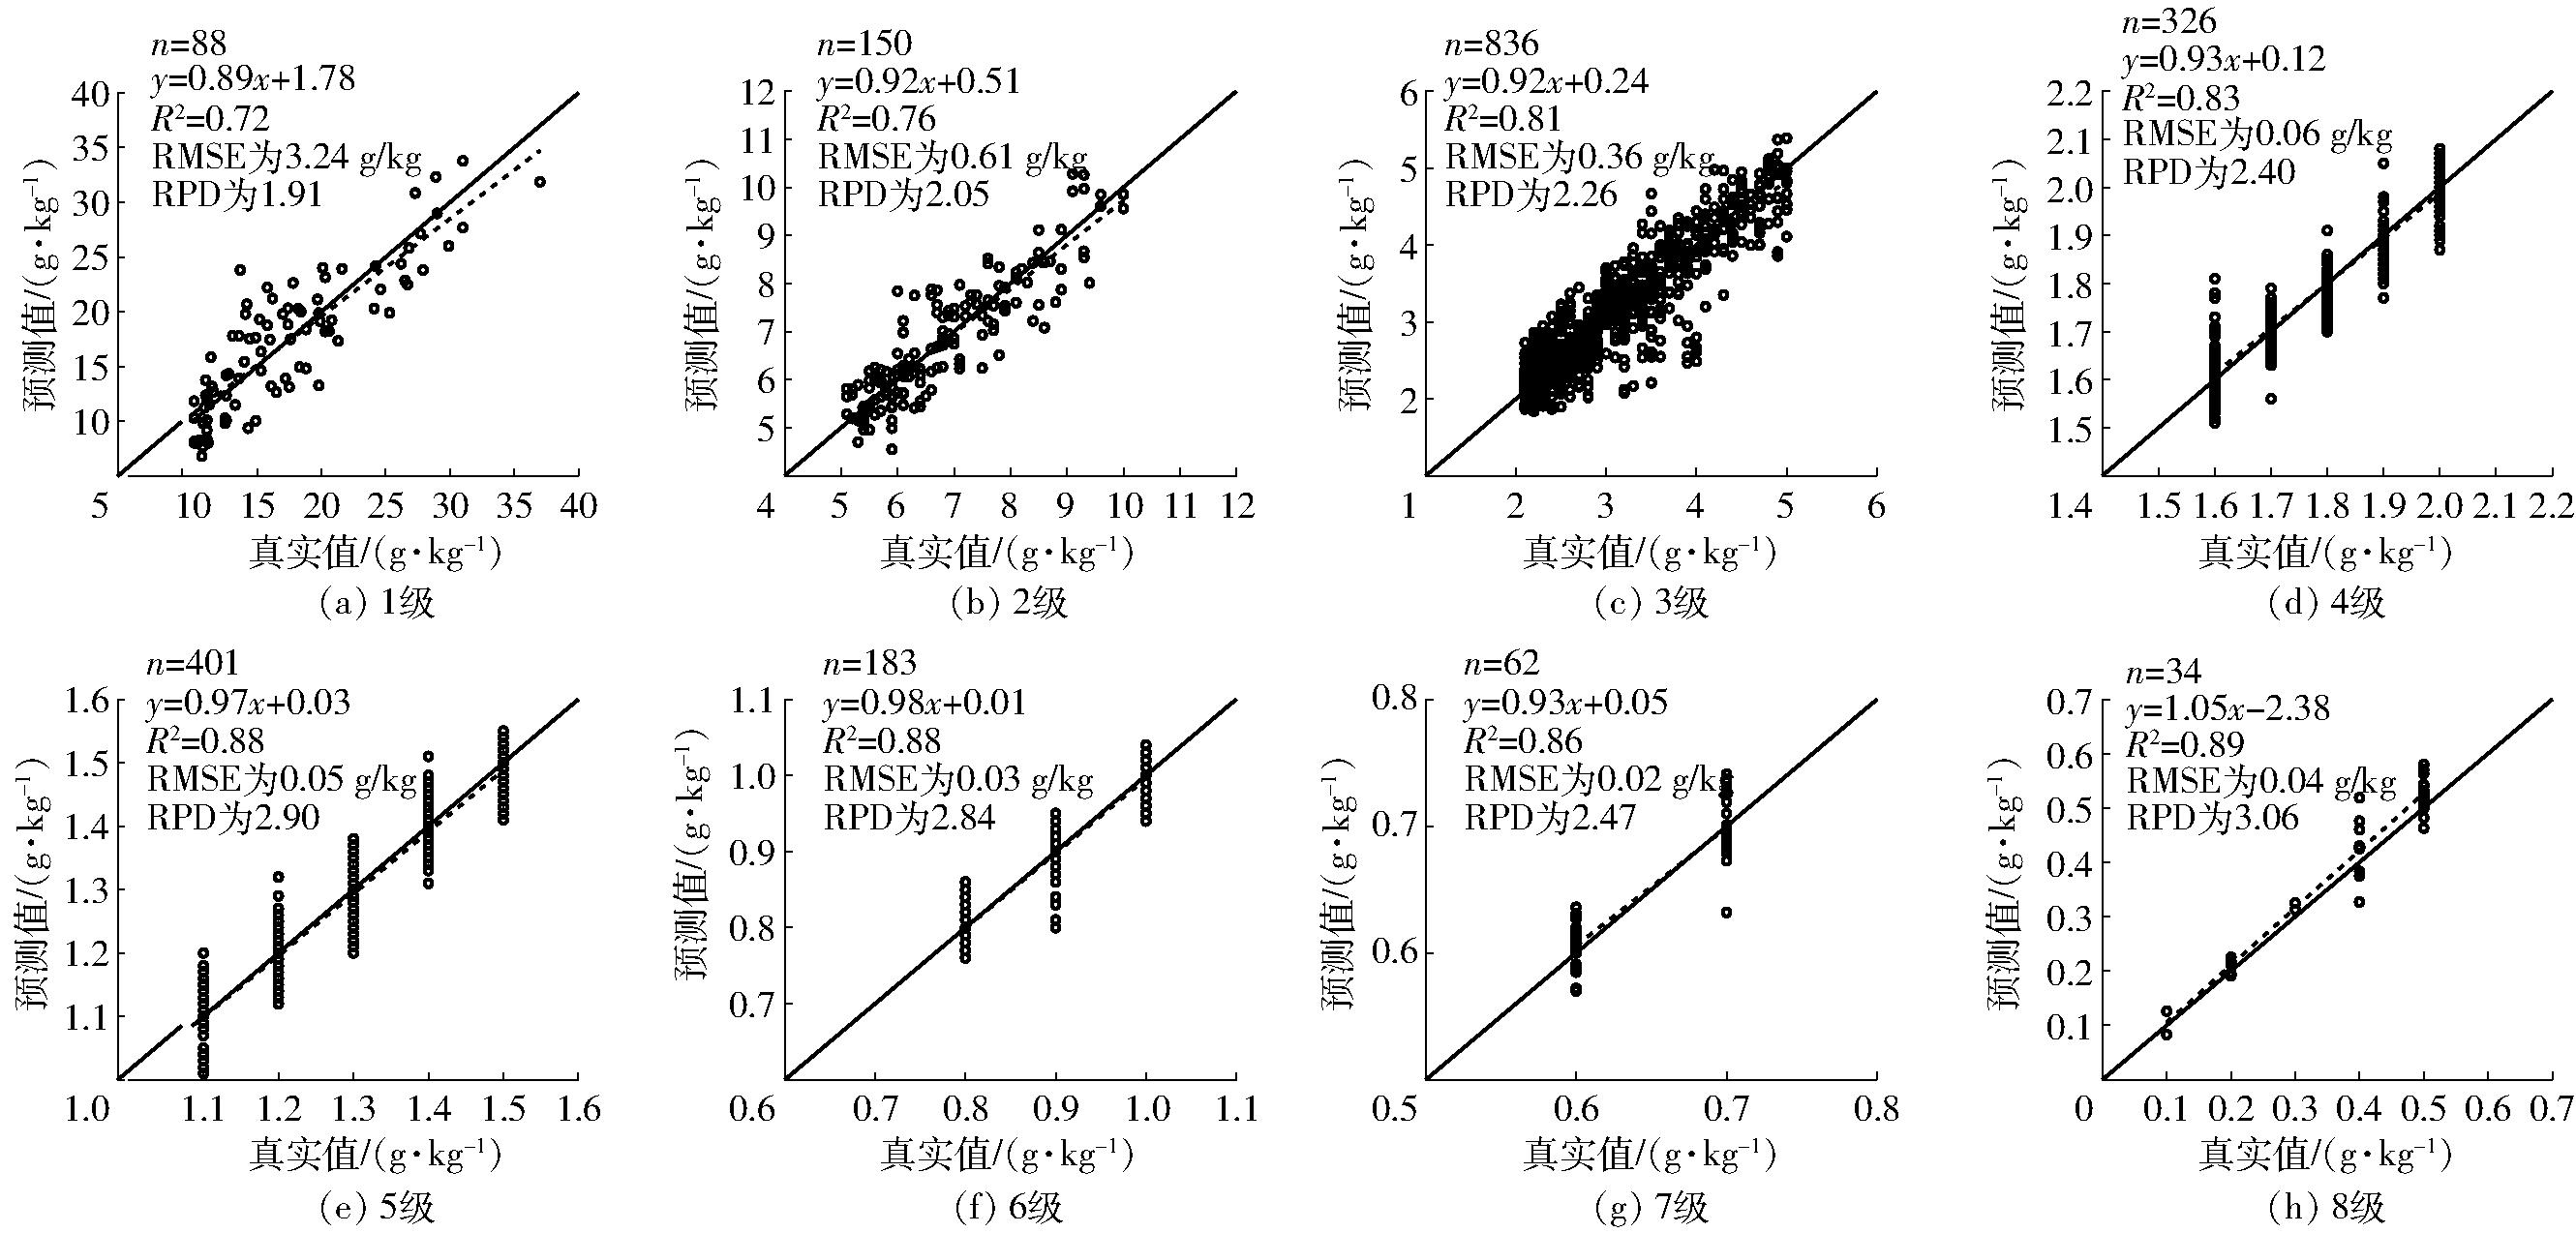
图6 VNIRSformer模型对测试集内不同土壤氮含量级别的预测
Fig.6 Prediction results of VNIRSformer for different grades of soil nitrogen content of test dataset
从图6可以看出,随着氮含量降低,VNIRSformer预测精度升高。当土壤氮含量大于5 g/kg时,模型预测精度R2小于0.8。当土壤氮含量小于5 g/kg时,模型预测指标R2大于0.8。可能原因在于所采用的公开数据集样本分布不均匀,公开数据集中87%样本的氮含量小于5 g/kg。
利用高氮含量和低氮含量两种自采数据集验证所建模型的泛化能力。其中高氮数据集(大于5 g/kg)从黑龙江胜利农场(东经133°45′,北纬47°24′)获取,低氮数据集(小于5 g/kg)从内蒙古自治区兴安盟科尔沁右翼前旗(东经121°92′,北纬46°07′)获取。两种自采数据集统计信息如表4所示。
表4 自采数据集统计信息
Tab.4 Statistical information of self-collected datasets

来源样本数最大值/(g·kg-1)最小值/(g·kg-1)平均值/(g·kg-1)标准差/(g·kg-1)高氮数据集 4427.4 5.023.3 4.3低氮数据集 444.90.42.2 1.3
利用VNIRSformer模型直接对两种自采数据集进行预测,预测结果如图7所示。
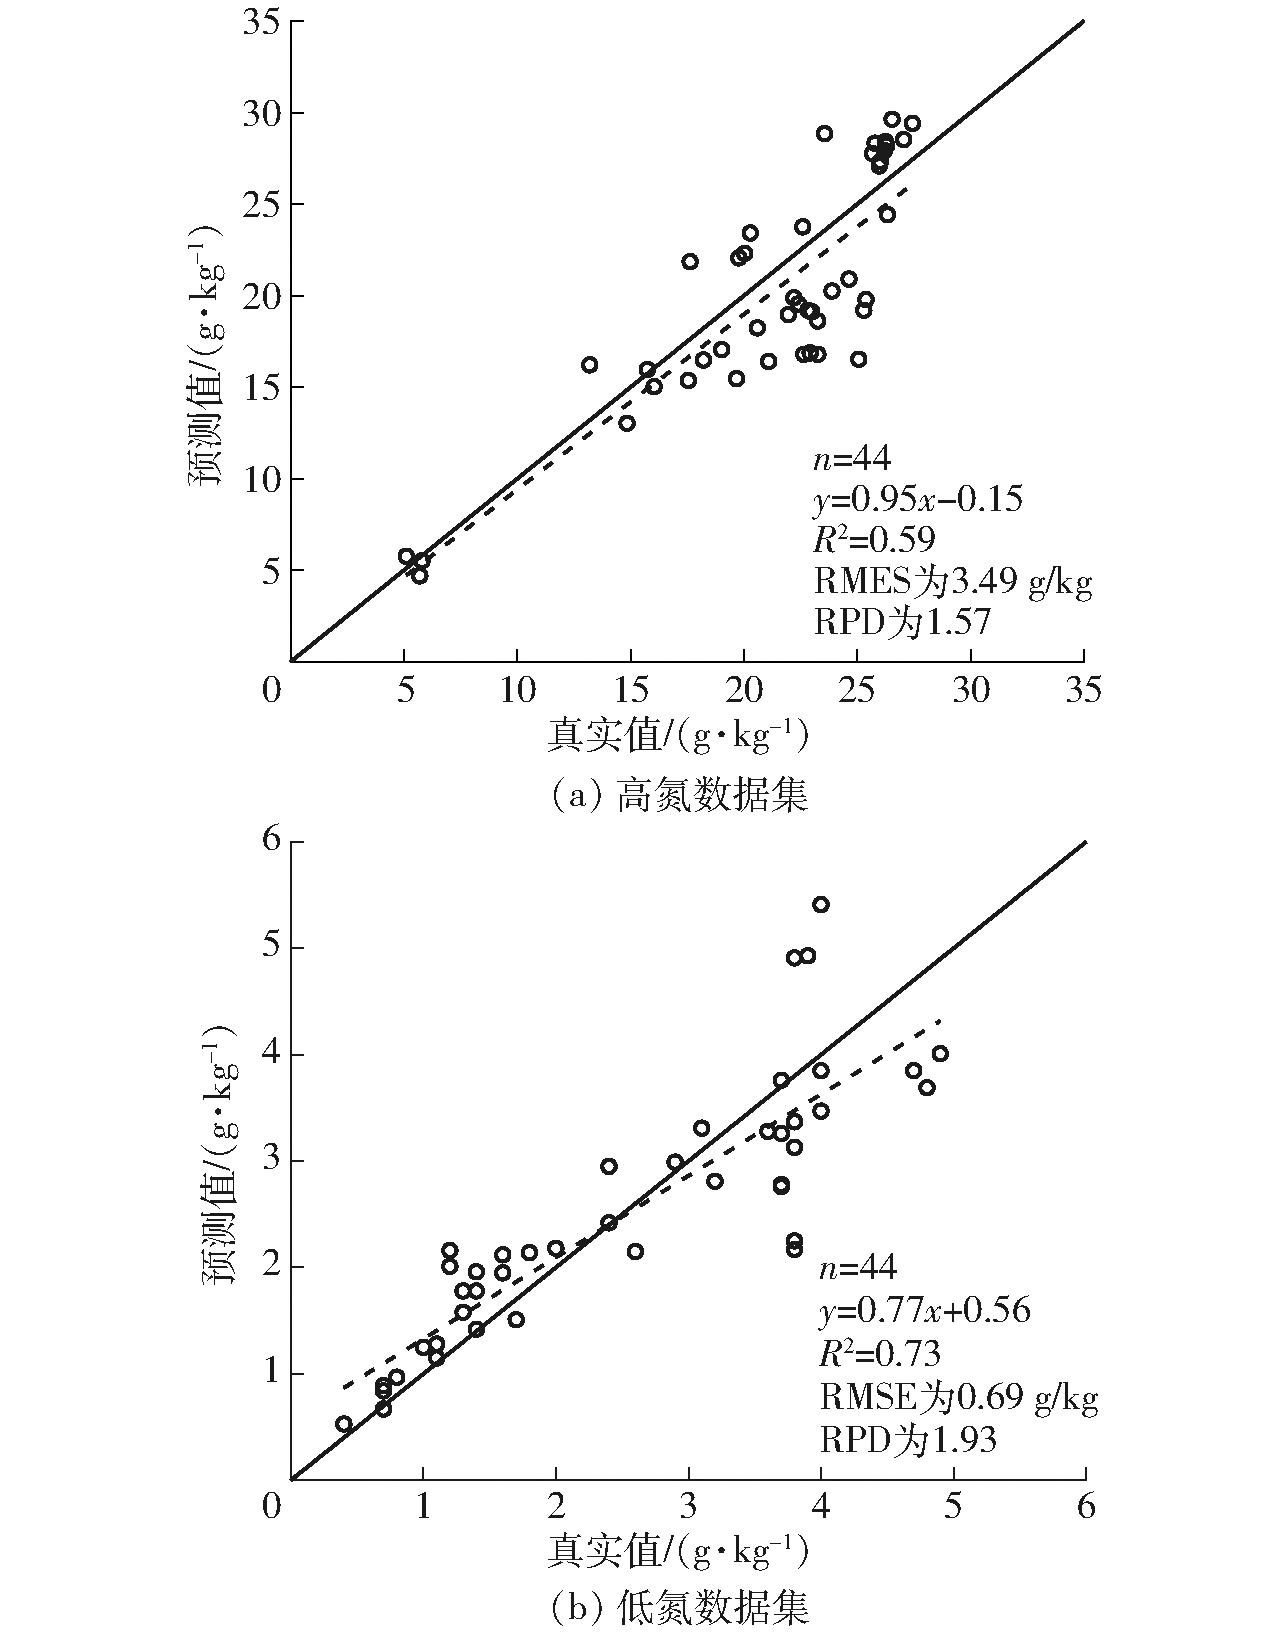
图7 VNIRSformer模型对自采数据集的预测结果
Fig.7 Prediction results of VNIRSformer for two self-collected datasets
从图7可以看出,VNIRSformer模型在高氮数据集预测R2为0.59,低氮数据集预测R2为0.73。在高氮和低氮两种自采数据集上的R2下降约0.17。可以发现,将VNIRSformer模型直接应用于全新数据,也能够获得较好效果,即模型具有一定的泛化能力。
3 结论
(1)可见-近红外光谱的波长间隔对基于深度学习的预测模型影响较大。随着波长间隔增加,模型预测精度先升后降,模型规模逐渐下降。综合考虑模型精度和规模,设置5 nm为最优波长间隔。
(2)注意力机制较卷积神经网络更适合用于基于光谱的土壤氮含量预测建模。对比实验结果表明,VNIRSformer模型在基于光谱的土壤氮含量预测任务中表现最佳,R2为0.89,RMSE为0.35 g/kg,RPD为2.95。自注意力机制的全局感知能力有助于发现光谱长序列内全局依赖关系。采用稀疏注意力机制可以减少模型训练时间。
(3) VNIRSformer模型对小于5 g/kg的土壤氮含量预测精度较高,且具有一定泛化能力。
[1] MUKHERJEE S,LASKAR S.Vis-NIR-based optical sensor system for estimation of primary nutrients in soil[J].Journal of Optic,2019,48(1):83-107.
[2] HONG Y,LIU Y,CHEN Y,et al.Application of fractional-order derivative in the quantitative estimation of soil organic matter content through visible and near-infrared spectroscopy[J].Geoderma,2019,337:758-769.
[3] 陈昊宇,杨光,韩雪莹,等.基于连续小波变换的土壤有机质含量高光谱反演[J].中国农业科技导报, 2021,31(3):132-141.CHEN Haoyu,YANG Guang,HAN Xueying,et al. Hyperspectral inversion of soil organic matter content based on continuous wavelet transform[J].Journal of Agriculture Science and Technology,2021,31(3):132-141.(in Chinese)
[4] 徐丽华,谢德体.土壤有机质含量预测精度对光谱预处理和特征波段的响应[J].江苏农业学报, 2019,35(6):1340-1345.XU Lihua,XIE Deti. Response of soil organic matter content prediction accuracy to preprocessing of spectra and feature bands[J].Jiangsu Journal of Agricultural Sciences,2019,35(6):1340-1345.(in Chinese)
[5] ZHANG Y,LI M Z,ZHENG L H,et al.Spectral features extraction for estimation of soil total nitrogen content based on modified ant colony optimization algorithm[J]. Geoderma,2019,333:23-34.
[6] 曹永研,杨玮,王懂,等.基于水分和粒度的土壤有机质特征波长提取与预测模型[J].农业机械学报,2022,53(增刊1):241-248.CAO Yongyan,YANG Wei,WANG Dong,et al. Soil organic matter characteristic wavelength extraction and prediction model based on moisture and particle size[J].Transactions of the Chinese Society for Agricultural Machinery,2022,53(Supp.1):241-248.(in Chinese)
[7] WARD K J,CHABRILLAT S,NEUMANN C,et al.A remote sensing adapted approach for soil organic carbon prediction based on the spectrally clustered LUCAS soil database[J]. Geoderma,2019,353:297-307.
[8] 王炜超,杨玮,崔玉露,等.基于CatBoost算法与图谱特征融合的土壤全氮含量预测[J].农业机械学报,2021,52(增刊):316-322.WANG Weichao,YANG Wei,CUI Yulu,et al. Prediction of soil total nitrogen based on CatBoost algorithm and fusion of image spectral features[J].Transactions of the Chinese Society for Agricultural Machinery,2021,52(Supp.):316-322.(in Chinese)
[9] 张鑫,杨超,刘洪斌,等.基于机器学习的植烟区土壤有机质和全氮含量预测[J].烟草科技,2022,55(8):20-27.ZHANG Xin,YANG Chao,LIU Hongbin,et al. Predictions on organic matter and total nitrogen contents in tobacco-growing soil based on machine learning[J].Tobacco Science &Technology,2022,55(8):20-27.(in Chinese)
[10] 胡国田,尚会威,谭瑞虹,等.不同土壤类型的有机质含量的可见-近红外光谱检测模型传递方法研究[J].光谱学与光谱分析,2022,42(10):3148-3154.HU Guotian,SHANG Huiwei,TAN Ruihong,et al. Research on model transfer method of organic matter content estimation of different soils using VNIR spectroscopy[J].Spectroscopy and Spectral Analysis,2022,42(10):3148-3154.(in Chinese)
[11] MISHRA P,PASSOS D,MARINI F,et al.Deep learning for near-infrared spectral data modelling: hypes and benefits[J].Trends in Analytical Chemistry,2022,157:116804.
[12] LIANG Z,GUO X,XU Z,et al.Soil properties: their prediction and feature extraction from the LUCAS spectral library using deep convolutional neural networks[J].Geoderma,2021,402:115366.
[13] 刘兰军,翟永庆,郑俊俊,等.基于PSO-CNN的土壤氮含量可见/近红外光谱建模[J].光学技术, 2021,47(4):438-445.LIU Lanjun,ZHAI Yongqing,ZHENG Junjun,et al. Visible/near-infrared spectroscopy modeling of soil nitrogen content based on PSO-CNN[J].Optical Technique,2021,47(4):438-445. (in Chinese)
[14] TSAKIRIDIS N L,KERAMARIS K D,THEOCHAIRS J D,et al.Simultaneous prediction of soil properties from VNIR-SWIR spectra using a localized multi-channel 1-D convolutional neural network[J].Geoderma,2020,367:114208.
[15] QIAO H,SHI X,CHEN H,et al.Effective prediction of soil organic matter by deep SVD concatenation using FT-NIR spectroscopy[J].Soil and Tillage Research,2022,215:105223.
[16] LEI T,SUN D W.Achieving joint calibration of soil Vis-NIR spectra across instruments,soil types and properties by an attention-based spectra encoding-spectra property decoding architecture[J].Geoderma,2022,405:115449.
[17] SHEN Z,LEONARDO R L,BEHRENS T,et al.Deep transfer learning of global spectra for local soil carbon monitoring[J].Journal of Photogrammetry and Remote Sensing,2022,188:190-200.
[18] DEVLIN J,CHANG M,LEE K,et al.BERT: pre-training of deep bidirectional transformers for language understanding[C]∥Proceedings of the 2019 Conference of the North American Chapter of the Association for Computational Linguistics,2019.
[19] DOSOVITSKIY A,BEYER L,KOLESNIKOV A,et al.An image is worth 16x16 words: transformers for image recognition at scale[C]∥9th International Conference on Learning Representations, 2021.
[20] ZHOU H Y,ZHANG S,PENG J,et al.Informer: beyond efficient transformer for long sequence time-series forecasting[C]∥Proceedings of the AAAI Conference on Artificial Intelligence,2021.
[21] NG W,MINASNY B,MALONE B P,et al.Optimizing wavelength selection by using informative vectors for parsimonious infrared spectra modelling[J].Computers and Electronics in Agriculture,2019,158:201-210.
[22] XU X,MA F,ZHOU J,et al.Applying convolutional neural networks (CNN) for end-to-end soil analysis based on laser-induced breakdown spectroscopy (LIBS) with less spectral preprocessing[J].Computers and Electronics in Agriculture,2022,199:107171.
[23] ZHANG X,LIN T,XU J,et al.DeepSpectra: an end-to-end deep learning approach for quantitative spectral analysis[J].Analytica Chimica Acta,2019,1058:48-57.
[24] 全国土壤普查办公室.中国土壤[M].北京:中国农业出版社,1998:860-934.
[25] 沈善敏.中国土壤肥力[M].北京:中国农业出版社,1998:351-382.